The physiological parameters in children vary to those in adults. As children get older their physiology changes (e.g. larger stroke volume) leading to variation in heart rate, respiratory rate etc.
Table: Normal vital signs in children (APLS values) |
|||||
| Infant | 1-2 years | 2-5 years | 5-12 years | Adolescent | |
| Pulse rate (bpm) | 110-160 | 100-150 | 95-140 | 80-120 | 60-90 |
| Respiratory rate (rpm) | 30-40 | 25-35 | 25-30 | 20-25 | 14-18 |
Blood pressure |
80-90 | 85-95 | 85-100 | 90-100 | 100-140 |
| Temperature (define if oral etc) | 35-37oC | 36-37.5 oC | |||
| Saturations | 94-98% | ||||
EWS systems are therefore more complicated in children, as the “normal ranges” of each scoring chart will change dependent on the age of the child to take into account for their changing physiology.
All early warning score systems at a minimum should monitor:
For each physiological observation, a score is given depending on the degree of abnormality. A high initial score will “trigger” a response from the nursing team (e.g starting oxygen, calling a doctor etc). At times the score will be normal or low but will progressively rise in a deteriorating patient (“tracking”). This “tracking” will again lead to a response from the team caring for the patient.
Learning point:Parents know their children well. Do not ignore parental concerns just because the PAWS score is normal or not markedly abnormal. |
In the remainder of this chapter we will use the above chart to explain how the Track and Trigger system gives a Paediatric Early Warning Score (PEWS) and how a health professional would respond to this score. Each chapter of this book has included a case-study with an attached PEWS score sheet. Therefore understanding how this is calculated is important.
As mentioned above, the correct age-specific chart needs to be used. This is to ensure that the normal ranges are appropriate for that age. There are usually charts available for:
There are then variations of each of these age related charts which include the option of “neuro-obs”. These are for children who require extra observation from a neurological perspective and includes the Glasgow Coma Scale and pupil reaction to light.
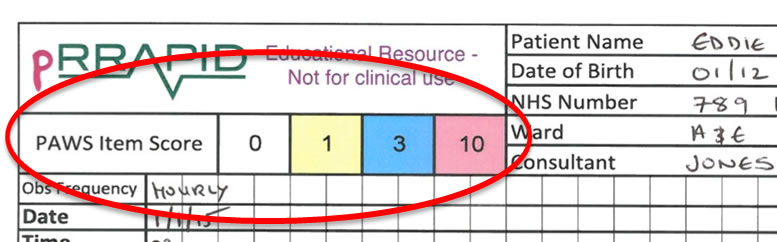
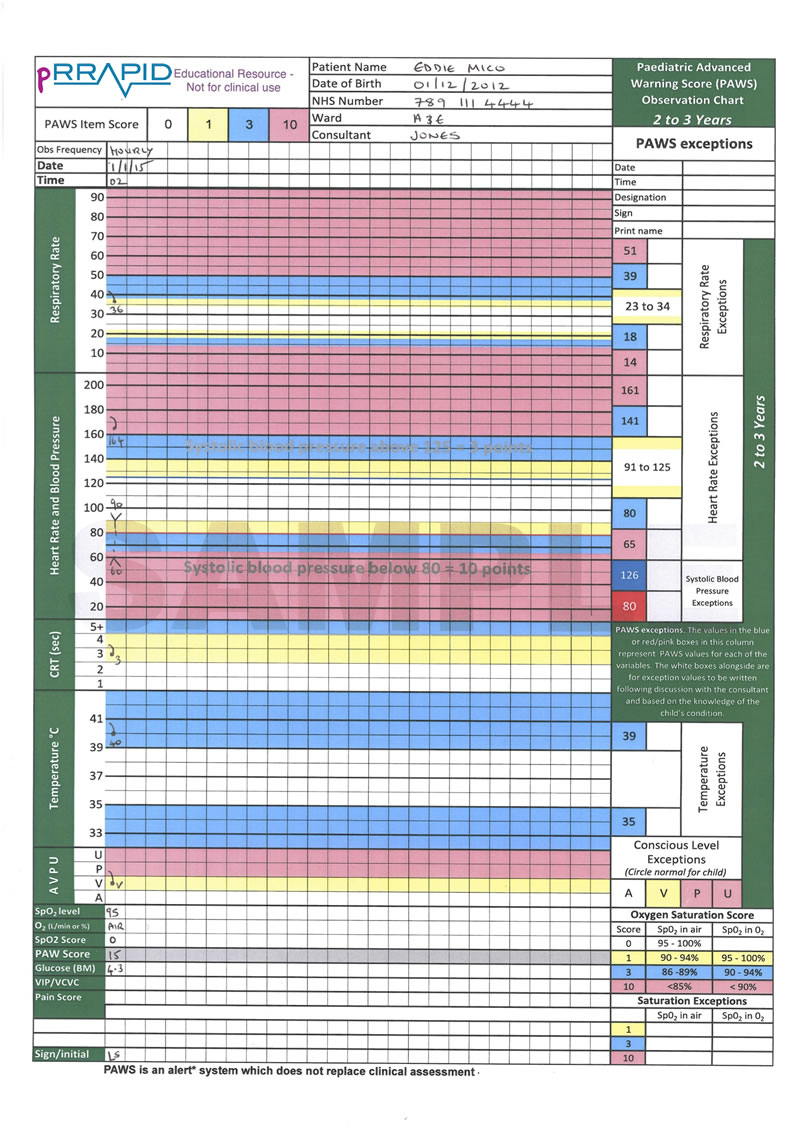
In the PAWS charts shown here scores of 0, 1, 3 or 10 can be given for each physiological parameter. In this chart a colour coding system is used to highlight the areas for different scores. To know the exact number for the score one needs to review the column down the right hand side of the chart (see figure below).
To identify the “reference ranges” for scores for heart rate, respiratory rate, capillary refill time (CRT), temperature & AVPU one should look down the right column. For example in this figure you can see the heart rates required for each score:
≤65 = 10
66-80 = 3
81-91 = 1
91-125 = zero (i.e. normal)
126-140 = 1
≥141bpm = 3
≥161bpm = 10
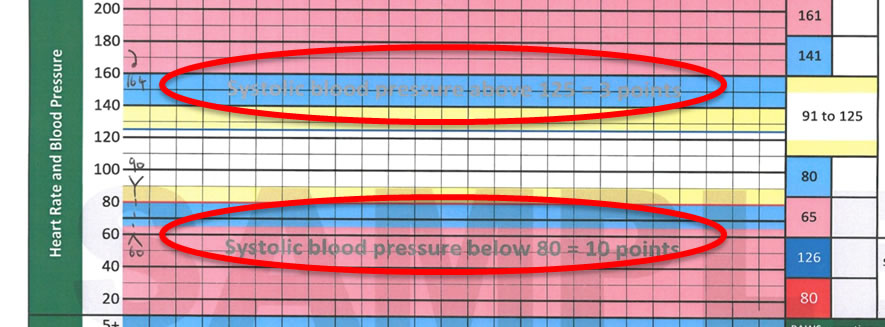
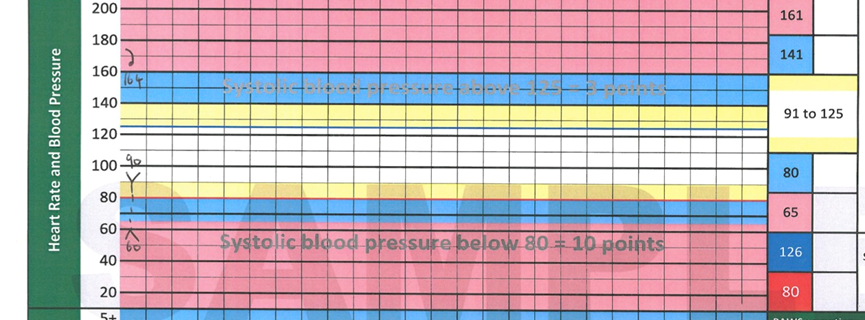
In this system only systolic blood pressure is used with a low BP giving you a score of 10 and a high BP giving a score of 3. The grey text shows the BP (in mmHg) required for to score for BP. These are also demonstrated, if you look carefully, on the chart by a grey line.
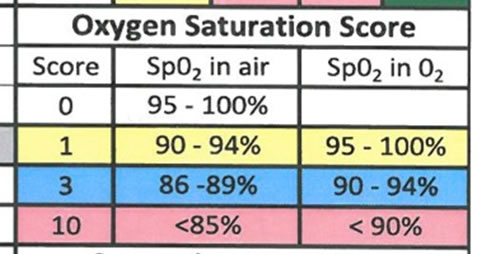
For oxygen saturations the scoring is a bit more complicated. The score will depend on wither the patient is on oxygen or not. As shown here if a child is on oxygen they will automatically score 1 point with this score increasing if they have low oxygen saturations.
Each of the 7 physiological parameters will generate its own “item score” (0-10). These are then added to create the total score (“the PAWS score”). For example in this case the patient has a total score of 15.
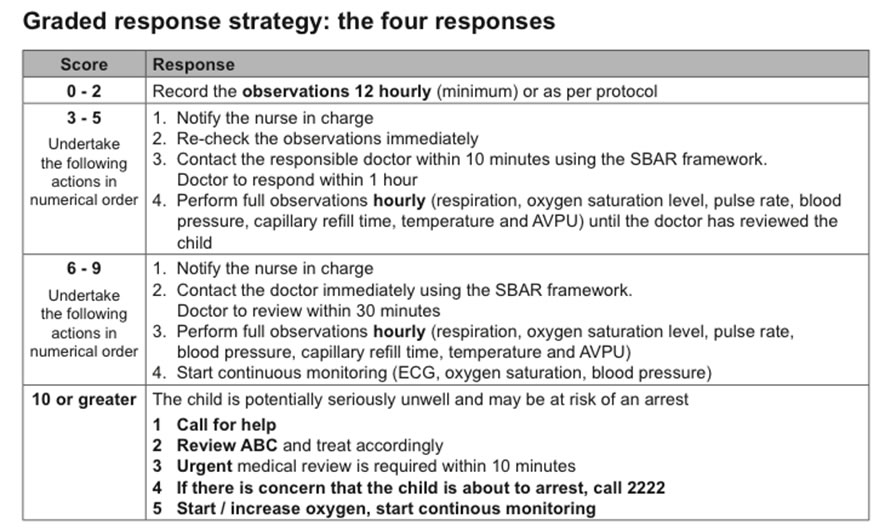
A single high score should “trigger” a response from the nurse caring for the patient. It’s important to know what these steps would be. This figure shows the “Graded response strategy” for a raised score. These strategies will usually be found on the chart. In this case they are found on the reverse of the chart. As a clinician you would rarely have to complete a EWS chart but it’s important that you understand how you are expected to react. For example if you are telephoned with a patient “with a PAWS score of 7” you would be expected to review that patient within 30 minutes.
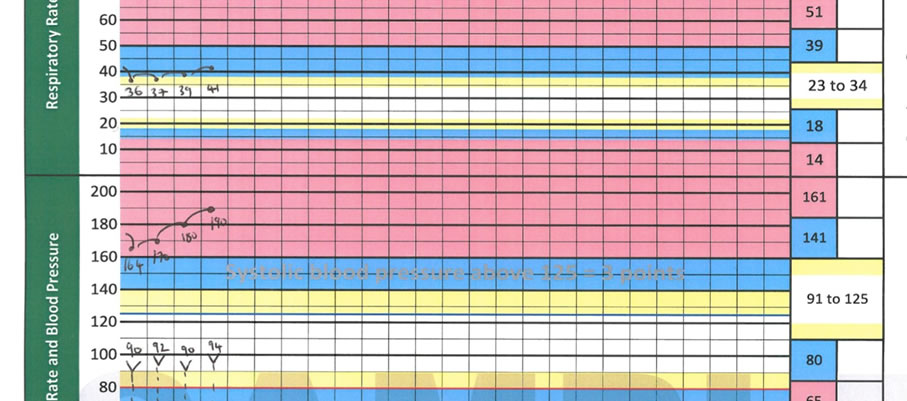
In this image you can visualise the “tracking” facility of an Early Warning Score. Physiological observations have been performed every hour. Only on the forth of these scores would the actual PAWS change from 15 up to 18. However there is a clear deterioration visible in terms of rising respiratory rate and rising tachycardia. This would warn a team of a deteriorating patient before the child collapses.